

Did Customer Feedback Change, or Did Different People Reply?
A changing survey score can reflect a changing mix of respondents. Learn how to separate the overall result from group patterns, investigate what changed and choose a useful next action.
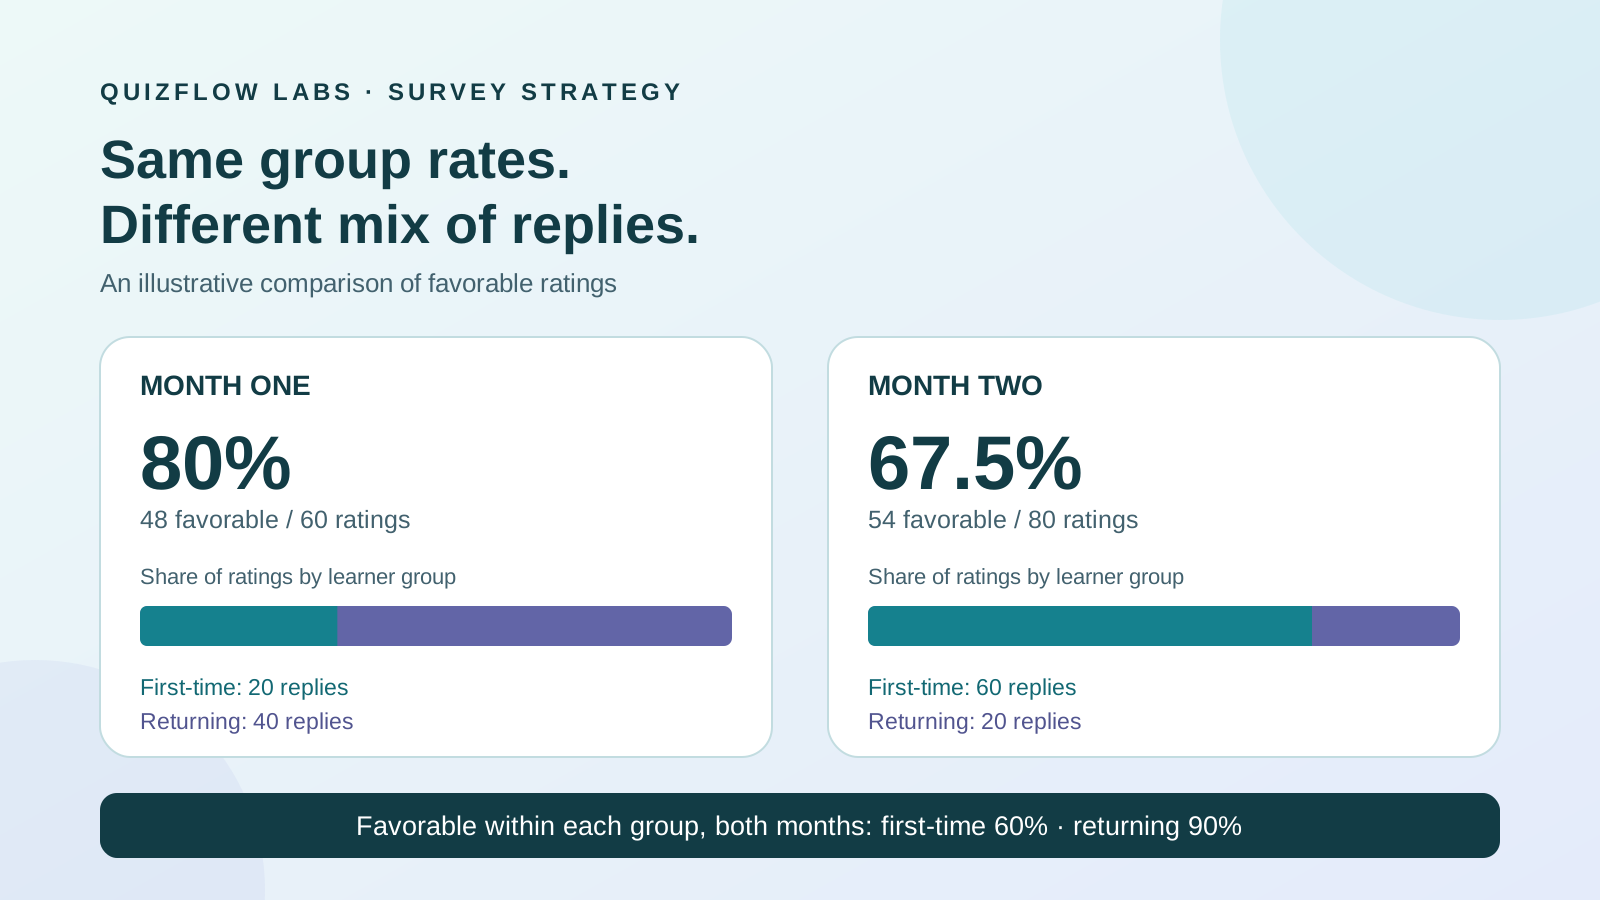
One total can hide two different changes
Customer feedback scores help businesses notice problems and decide what to investigate. But a higher or lower total does not, by itself, explain what happened. A survey can receive a larger share of replies from customers who have different needs, expectations or experiences than the people who replied last time.
That creates two questions: did ratings change within a relevant group, and did that group's share of replies change? Both matter. Separating them helps a creator or service business decide whether to investigate a worsening experience, support a growing audience or repair an inconsistent feedback process.
Start by treating the score as a description of the answers collected. Extending that description to every customer, or claiming a recent change caused it, requires more evidence. The goal is a defensible next decision rather than a more flattering number.
Compare the same measure before comparing people
First check that the two surveys asked about the same experience. Preserve the question wording, answer choices, question order, invitation method and timing relative to the customer interaction. A rating collected immediately after a lesson is not interchangeable with one collected after a month of applying it.
Pew Research Center's question-writing guidance explains why wording and question context matter when measuring change over time. If a flawed question needs improvement, improve it, but record the break in the series. Do not interpret the difference as a clean measure of changing customer experience.
Define the calculation before looking for a pattern. For example, a favorable rate might mean the number choosing Satisfied or Very satisfied divided by the number giving a satisfaction rating. Include neutral and unfavorable scale answers in that denominator. Keep blanks and Not applicable outside it and report them separately. Use the same definition in both periods.
Decide whether the unit is a person, purchase or completed session. Ten submissions from one frequent customer are different from ten customers replying once. Apply the same inclusion rule in both periods, and only describe unique people when the records justify that count.
Read Pew's guidance on measuring change over timeOpens in a new tabChoose a useful comparison group before searching for differences
Choose a characteristic that could plausibly change the experience and lead to a different action. First-time versus returning customers may matter for onboarding. Service type may matter when different teams deliver different offers. Avoid collecting personal details simply to create more ways to slice the results.
Make the groups clear, consistently defined and non-overlapping for the comparison. Someone can be both a returning customer and a first-time user of a particular service. Specify which relationship matters. Keep missing or unclear group answers visible instead of silently assigning them to a convenient category.
Begin with one decision-relevant split. Combining experience level, offer, channel and device can leave tiny groups in which one answer moves the percentage dramatically. A split discovered after trying many alternatives is a clue to investigate, not strong confirmation of an explanation.
Put counts beside rates in each period
For each group, record the number of valid ratings, the number favorable and the favorable rate. Then calculate the group's share of all valid ratings. The first rate describes answers within the group; the second describes how much that group contributes to the overall result.
Keep valid ratings with missing or unclear group information in a separate Unknown group row. The group counts should add up to the overall valid-rating count. Calculate the overall favorable rate from total favorable ratings divided by total valid ratings. Do not simply average group percentages when the groups have different numbers of answers: that would give a small group the same influence as a large one.
If invitation records are available, compare who was invited with who replied, using the same eligibility and counting rules. A rise in first-time respondents could follow a rise in first-time customers, a wider invitation list or different participation. Without those records, describe the changing mix of replies; do not assume the customer base changed.
An example: a lower total with unchanged group rates
Consider a hypothetical online course business comparing two monthly sets of feedback. It invites each learner once after their first completed lesson that month and accepts one reply per learner. The question, scale and response window stay the same. First-time learners are taking their first course with the business; returning learners have taken one before. All replies in this example include a valid rating and group answer.
Month one
First-time learners give 12 favorable ratings out of 20: 60%. Returning learners give 36 out of 40: 90%. Together, 48 of 60 ratings are favorable: 80%. First-time learners provide one-third of the ratings.
Month two
First-time learners give 36 favorable ratings out of 60: still 60%. Returning learners give 18 out of 20: still 90%. Together, 54 of 80 ratings are favorable: 67.5%. First-time learners now provide three-quarters of the ratings.
The overall rate falls by 12.5 percentage points even though neither group's observed rate falls. More replies come from the group with the lower favorable rate. The aggregate decline alone would be a poor reason to conclude that the course deteriorated within either group.
The first-time experience still deserves attention. A 60% favorable rate among those respondents may point to a support or expectation problem worth exploring. Check what they found difficult and whether the course promise suits their starting knowledge. Also check invitation records before deciding whether the business is serving more first-time learners or simply hearing from more of them.
This arithmetic explains these collected answers. It does not establish that all first-time customers have a 60% favorable rate, that individual learners stayed equally satisfied or that nothing changed inside either broad group.
Use the pattern to choose the next investigation
When the total changes but group rates look similar, investigate composition and the needs of the lower-scoring group before redesigning the whole experience. When one group's rate changes, examine what that group encountered: a different offer, access problem, instructor, expectation or support path.
When several groups move in the same direction, a shared experience or measurement change becomes a useful hypothesis. Check release notes, delivery records and survey changes. Agreement across groups strengthens the reason to investigate a common factor; it does not identify the cause.
When counts are small, show the fraction as well as the percentage. A move from four favorable replies out of five to three out of five is one fewer favorable reply, despite the large-looking percentage change. There is no universal reply count that turns voluntary feedback into a representative customer study. For a costly decision, gather more suitable evidence rather than treating a small percentage movement as a verdict.
A reproducible failure can still justify a repair. If a comment reveals that new learners cannot open the exercise file, verify and fix that access problem. You do not need to prove that it explains the aggregate score before helping affected learners.
Do not use an adjusted total to hide a real audience need
It can be useful to ask what the overall rate would look like if the two periods had the same group proportions. That is a different question from describing the replies actually received. Choose and explain the reference mix before using an adjusted number; keep the observed counts and group results beside it.
Pew's explanation of survey weighting describes using known population information to adjust sample imbalances. Equal-sized groups or last month's proportions are not automatically the correct picture of a customer population. A comparison with a fixed mix also cannot recover the views of people who did not reply.
For many small-business decisions, the group comparison is more useful than a single adjusted score. A growing first-time audience may create a real need for better onboarding even if a fixed-mix total looks stable. If a population estimate is essential to an expensive decision, get help with the sampling and analysis design rather than inventing weights to smooth the trend.
Read Pew's explanation of survey weightingOpens in a new tabMake the next feedback flow easier to interpret
Collect only the context needed for the comparison. In QuizFlow Labs, a Multiple Choice question configured for single selection can capture a clearly defined experience group. A Text Response can ask for the reason behind a rating, such as What most influenced that rating? Keep the main rating's wording and position consistent between rounds.
Place any new explanation prompt after the rating if that is the established sequence, and record additions rather than assuming they have no effect on participation. Preview each question with realistic answers. Check that someone who does not fit a group has an honest way to answer, and that an unanswered context question remains distinguishable during analysis.
Keep a comparison note outside the public flow: who was eligible, how invitations were sent, when replies were accepted, which version ran and how valid answers were counted. This is a manual analysis record, not something the respondent needs to complete.
Write a conclusion that leads to a decision
A useful feedback summary names the observed change, the relevant counts, the group pattern and the next check. For the course example: the overall favorable rate fell from 48 of 60 to 54 of 80 replies; group rates stayed at 60% and 90%, while first-time learners' share rose. The next step is to investigate their experience and check how invitations and participation changed.
AAPOR's survey guidance emphasizes transparent methods and care when interpreting nonprobability samples. Even within a group, people who reply can differ from those who do not. Report that limit where it changes the decision, and use comments, task observation or direct verification to investigate specific explanations.
For the next comparison, keep the measure consistent, retain the counts and choose one action the evidence can support. A survey becomes a useful decision flow when the answers lead to a justified follow-up, rather than an unsupported story about a moving score.
Read AAPOR's survey research best practicesOpens in a new tabTurn feedback into a useful next step
Build a feedback flow you can learn from
Use QuizFlow Labs to collect structured answers and focused explanations. Start with the decision the feedback should inform, then build the questions that help you make it.
Create your feedback flow